
Economics of the Kingdom of Vestland
by Fabrizio Nuzzaci from Threshold Magazine issue 28
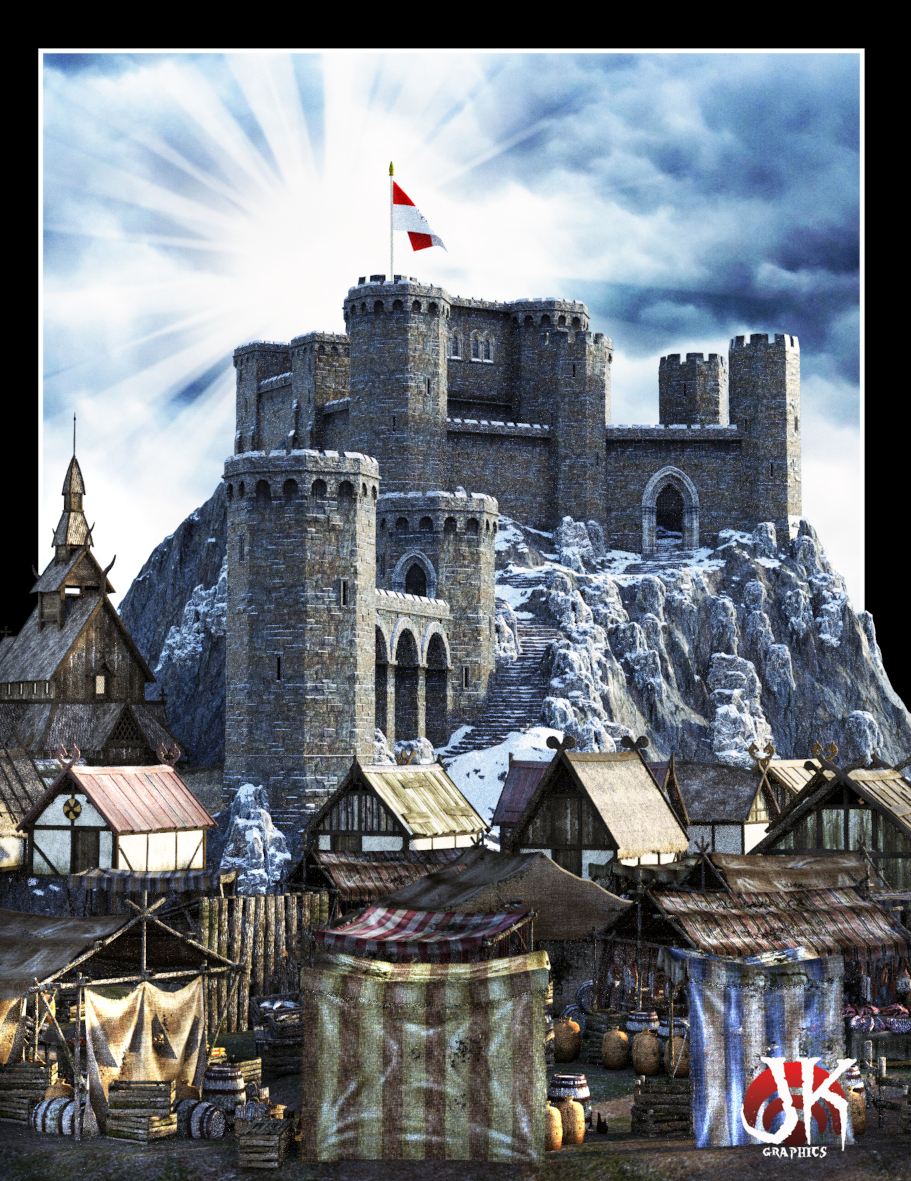
Vestland
market, originally drawing by Jeffrey
Kosh
(https://jeffreykosh.wixsite.com/jeffreykoshgraphics/home)
Hi everyone, this is my latest version (7.4+) of the realm of Vestland (Oct 10, 2021).
My interest is to visualize, on hex maps, the settlement areas of human populations and other "friendly" peoples, basing myself as much as possible on the available game information (and integrating them where missing).
This is in order to simulate the economies of the various domains found there.
This could be useful for both in-game "campaigns" ("where are the bad guys?") And for the creation of domains by the PCs.
During an RPG session, have you ever asked yourself questions like "how many dwellers could live in that map hex?", "How many troops can that nation enlist?", "How many resources can I get if I conquer my neighbor?"
Here I try to give an answer.
If you intend to play and enjoy the pleasure of adventure, stop reading here (cit.)
(How much I love this sentence).
I must first thank Thorfinn Tait for his great work in mapping Mystara and his generosity, giving me the ability to modify his maps.
In particular, the one used here is an "updated" map, not one faithful to the original.
Regarding Vestland, I drew up 3 different demographic maps (“basic” demographic, “density” and “military”).
Compared to the original map and to that of Thorfinn, on these maps I have:
- added some villages in some fiefdoms that did not have them (marked with the word "new"), considering it reasonable that there is always at least 1 village in each fief;
- added some places described in single adventure modules (X3: “Curse of Xanathon” and X13: “Crown of Ancient Glory”);
- added some camps along the great trade route (described in Gaz7: “The Northern Reaches”);
- made slight changes to the boundaries of the "duchy" (more correctly: barony) of Rhoona.
Note: these maps also show a demographic distribution of the population for the nations of Soderfjord amd Ostland but, for these two nations, it is only a "draft" as I have not yet verified whether such a distribution fits in with the number of inhabitants of the individual domains.
1) "Basic" demographic map:
http://pandius.com/NorthernRaces8mMIA_DEMOGR_UPDATED+CONFINIThorfinn2018.png
Map 1: Demographic map
Map 1 shows the distribution of the population, highlighted in color:
- dark green = very civilized (density greater than 20 inhabitants per square mile;
- light green = civilized (from 5 to 19.99 inhabitants per square mile);
- yellow = borderland (from 1 to 4.99 inhabitants per square mile);
- purple = wilderness (from 0.01 to 0.99 inhabitants per square mile);
- other colors = no human population (but ... what about monsters ??).
GAZ7 provides the following information about the civilization level of the various territories, expressed in inhabitants per square mile (sq m):
- plateau (central and eastern territories): 20+ inhabitants / sq m only in river valleys and nearby large commercial cities;
- hills (Trollheim): <1 inhabitant / sq m only in the river valleys and lands bordering the plateau (the rest is desert);
- foothills (Makkres): <1 inhabitant / sq m only in "some" areas suitable for raising sheep (the rest is desert);
- mountains (Makkres): <1 inhabitant / sq m (inhospitable).
It follows that*:
- plains and woods (which are not close to Trollheim or to the Makkres Mountains) may have a population density not exceeding 20 inhabitants / sq m (or higher, if in river valleys or close to major commercial cities );
- hills, hills / woods and forests (which are not close to Trollheim or the Makkres Mountains) may have a population density of no more than 10 inhabitants / sq m;
- the mountains never go beyond the "wild" level (<1 inhabitant / sq m), except for the territory of Rhoona.
(*) Having to adapt these descriptions, with the population actually shown for each domain, I considered reliable:
- assign a population exceeding 20 inhabitants / sq m in single hexes where there are urban centers (with the sole exception of Sveamark, where there are two hexes with a population well above this limit);
- exceed the limits indicated for the mountain and foothill areas of Rhoona (this is necessary given the considerable amount of inhabitants, concentrated in a narrow territory through which the Great Trade Route passes).
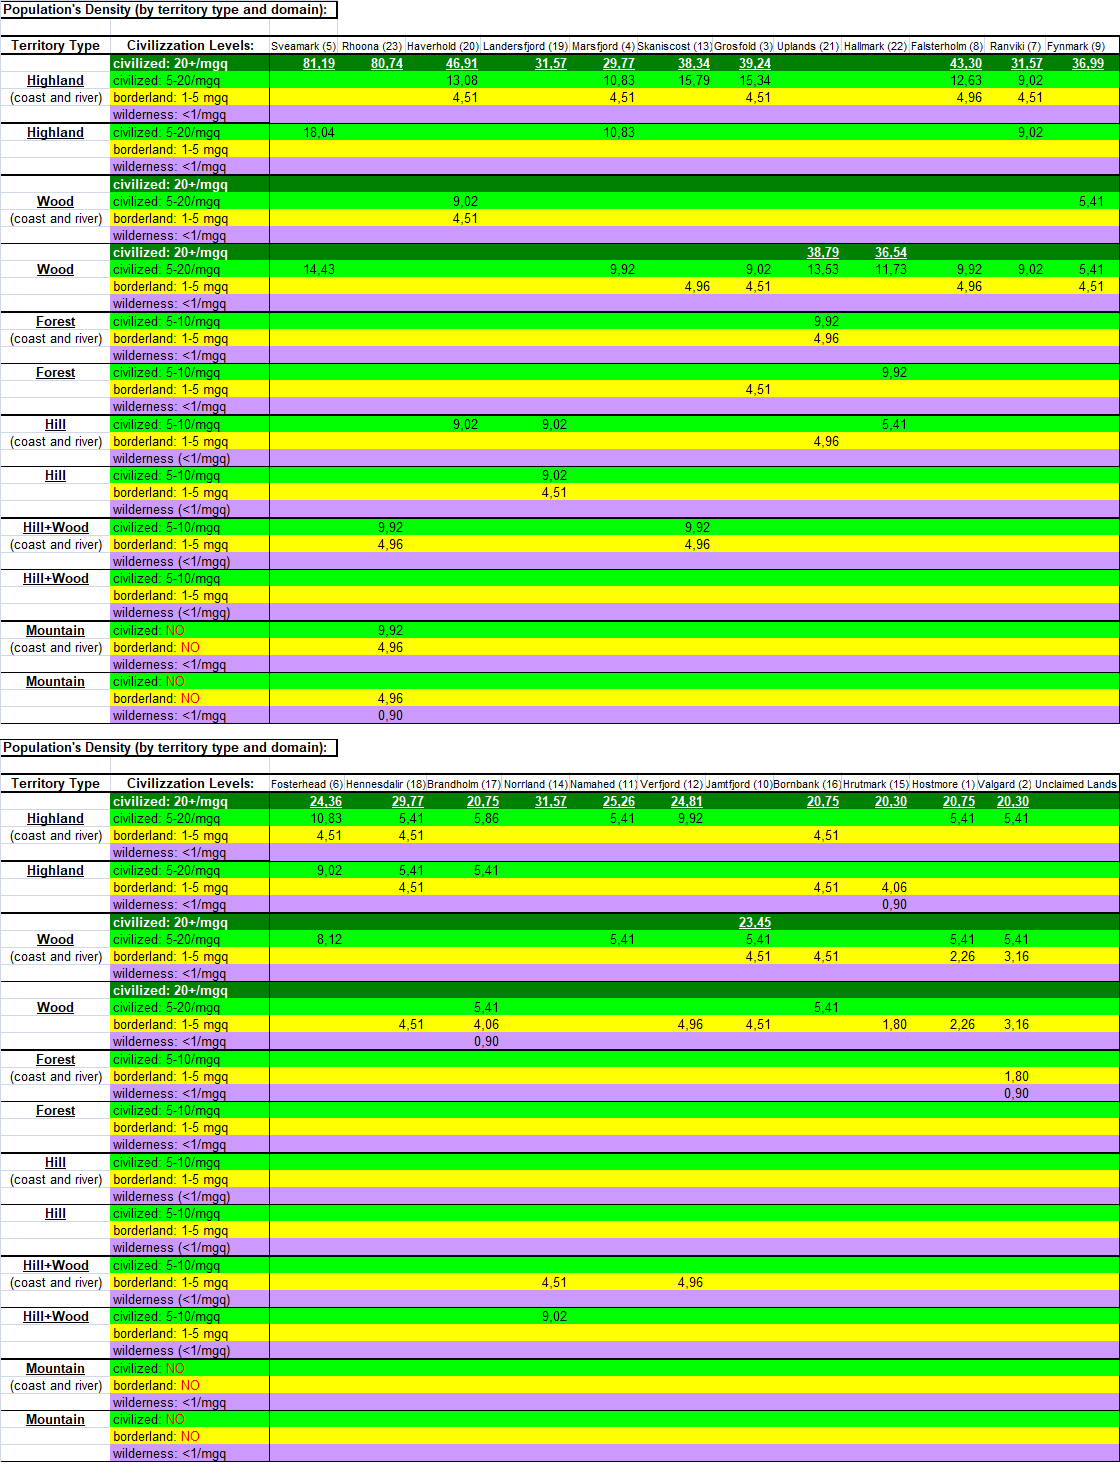
2) "Density" demographic map:
http://pandius.com/NorthernRaces8mMIA_DENSITA_UPDATED+CONFINIThorfinn2018.png
Map 2: Density map
Map 2 shows the population density of the single (or groups of) hexes, rounded to the second decimal place.
For the sole purpose of population density, it should be noted that the population residing in urban centers is not added to that living on the single hex of the territory. This is due to my method in simulating economies.
Now, knowing that an 8 mile diameter hex has an area of 55,426 square miles (sq m), it is easy to calculate how many inhabitants live (on average) in a given map hex (or group of hexes); as written just above, this number does not include the population of any urban centers.
Otherwise, more simply, look at the individual details of the domain you are interested in.
In my representation I have distributed in the single hexes the entire population indicated in GAZ7 and TM2 “The Eastern Countries Trail Map”: 161,000 inhabitants (note: PWA1 “Poor Wizard's Almanac AC 1010” instead indicates a population of 160,000).
Anyone who wants to is always free to add more population according to their campaign.
3) "Military" demographic map:
http://pandius.com/NorthernRaces8mMIA_MILITARI_UPDATED+CONFINIThorfinn2018.png
Map 3: Military map
Map 3 shows the military units supported by the single domains in peacetime.
Explanation of the annotations:
- "1v" means 1 vessel, whose crew is composed and equipped as described in PWA1;
- "105d" means 105 defensive F2 (officers excluded), composed and equipped as described in GAZ7 (DM’s book, page 62);
- "70a" means 70 attacking F2 (officers excluded), composed and equipped as described in GAZ7 (DM’s book, page 62).
So, for example:
- Norvikk ("12v" and "210d") stably deploys 12 vessels and 210 F2 for defense *;
- Helega ("1v", "35a" and "70d") stably deploys 1 vessel, 35 F2 for attack and 70 F2 for defense.
(*) Note: Sveamark deploys also 140 F2 on 4 camps along the Great Trade Route.
Now, let's remember that it is a Viking culture: the real attack troops are those embarked on vessels (level 3 fighters).
The ground troops (level 2 fighters, both "defensive" and "attacking" ones), are in fact employed for the defense of the inhabited centers, of the positions along the Great Trade Route, and to guarantee a minimum patrol of the territory; nothing more.
In my simulation, the vessels make up the 14 divisions mentioned in PWA1.
In peacetime, each division is commanded by a F9, has a F8 deputy commander, has 6 F15 heroes and 6 C8 heroes, and is composed of 1 single regiment with 2 vessels (each vessel has 75 F3, 3 F4 sergeants and 1 F5 Lieutenant), as described in PWA1, p. 129.
In wartime, the number of regiments will increase to 8 (see PWA1).
Where a fiefdom deploys 1 single vessel, it has been merged with the single vessel of another fiefdom, to form a division (example: Namahed and Verfjord).
This is indicated in the individual domain sheets (continuing the example: Namahed: "Division 16-I / 16, Regiment 1, Vessel 1"; Verfjord: "Division 16-II / 16, Regiment 1, Vessel 2"), and is highlighted in the summary (by a rectangle that encloses the "navy" troops of the two domains involved); in these cases, finally, the senior officers are a dependent of one domain and the other dependent of the second (continuing the example: Namahed supports the F9 captain and Verfjord the F8 captain).
B) Economic Simulations:
A full spreadsheet detailing the economic simulations for the 23 individual dominions of Vestland can be found at the Vaults of Pandius: http://pandius.com/evstecon.html. An example for one of the dominions follows below.
Note: refer to this example for battle informations (BFR, VB, speed and class) of the troops of each fiefdom, because I have recently recalculated and updated.
All these economic simulations have been developed referring to the information and descriptions provided in GAZ7 and in some other D&D supplements (PWA1, TM2, X3 and X13), trying to remain consistent to them as much as possible.
The resources (vegetables, animals and minerals) of each fief are based on the description given in GAZ7.
For the purpose of the constraint of assigning at least 20% of households to each resource, population has been distributed referring to 8-mile (instead of 24-mile) hexes.
As stated above, all ground troops are composed as described in GAZ7 (DM’s book, page 62), while fleets are composed as described in PWA1 (page 129).
The rules for calculating income and expenses of individual fiefdoms applied here are mainly based on the rules of D&D BECMI-Rules Cyclopedia, albeit with some of my additions (eg. families engaged in trade, crafts or wealthy).
From this point of view, I am happy with the result as:
- TM2 indicates a monthly Kingdom (Sveamark) availability of 12,800 gp;
- my calculations show that, every month Sveamark receives taxes and fees for a total of 12,841 gp (not considering the Ordinary Income, provided in nature and to be sold);
- however, we should also add about 38,700 gp / month as "cash" for the Salt Tax paid by the various fiefdoms (except Verfjord, Jamtfjord and Hrutmark who pay Salt Tax to their respective feudal superiors: Namahed and Bornbank).
Also for the cost of troops and specialists I had to integrate the official rules of the game.
For example:
- the cost of a soldier with 2 HD (or 3 HD) is increased by + 10 gp (or + 20 gp) compared to the base cost indicated for soldiers with 1 HD (see D&D Expert Set);
- the cost of the officers is 20 gp / HD / number of months of service (while, following the BECMI rules, a sergeant with 4 HD would cost only 20 gp / month).
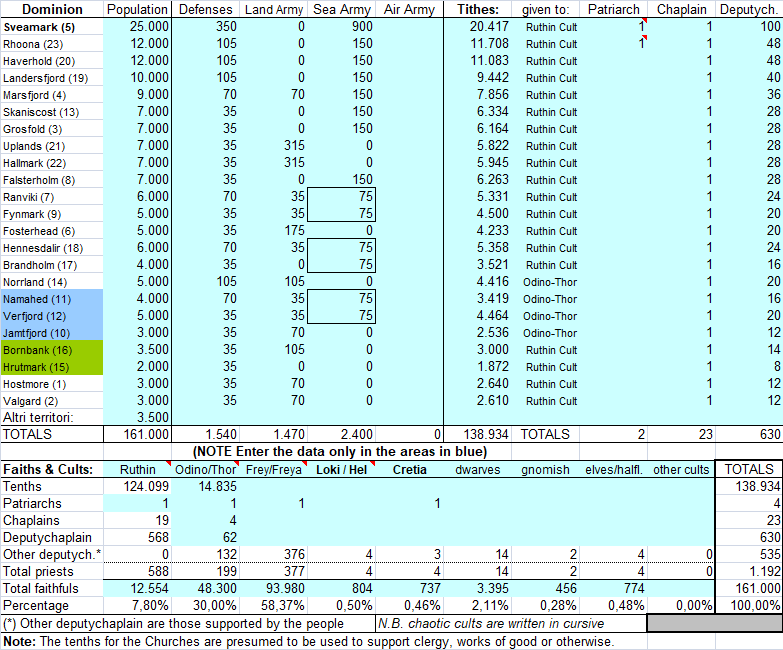
After all, in my simulation, "in peacetime" Vestland has a total of more troops (TOTAL 5,410 troops, of which: 1,540 defensive, 1,470 attacking and 2,400 embarked; the latter are divided into 14 naval divisions equipped of 2 vessels each), compared to what is indicated in TM2 (1,800 troops) or PWA1 (1.5% of 161,000 inhabitants = 2,415 troops)1.
Note that, despite this, the main strength of each fief (constituted by the naval divisions) is still minimal: in fact only Sveamark is able to deploy more than 2 vessels, while some minor domains cannot support even one.
We assume that they are not the only troops in the whole nation, but that there is still someone left to defend it.
On other topics, however, I tried to make a realistic simulation.
For example, the "Food Balance" section is based on rules that I wrote after reading several articles.
For Vestland there is no need for clerics to create food to support food production: the Viking culture is a warrior culture, yes, but with resources that are (barely) enough to support the population; in any case, the cult was concerned with more spiritual things than sowing oats.
One final note: the Order of Ruthin (the cult of the nobility) receives 124,084 gp / year from tithes; the offerings of the faithful should also be added to this sum.
The Cult of Odin and Thor also receives 14,835 gp from tithes and certainly collects many donations from the faithful.
How to spend these sums, I leave it to the imagination of those who want to use this system.
EXAMPLE ECONOMIC SIMULATION: SVEAMARK
What follows below is my economic simulation for Sveamark (Vestland's main fief), published with the aim of explaining to the readers how and where to look for information of interest to them, both in this and in the other economic simulations referred to in this article.
Therefore, this is not a clear and complete explanation of all the work behind these sheets, nor of the information on which I relied. I would also like to point out that some of the information present in this, as in the other sheets, are also reported in the demographic maps ("basic", "density" and "military") included in this article; however, only the spreadsheets provide complete information on each domain.
To carry out this work I used my Excel file "Fiefs Generator" (v. 7.4)2, which I adapted to the rules for managing domains described in D&D BECMI (and then in Rules Cyclopedia), with a single hint from D&D 3E (the “gp” limit) and some of my further additions aimed at making the simulation more realistic.
The ultimate goal of this work is to allow each DM to have quick and complete access to game information, providing a ready-made campaign and thus saving them preparation time.
To help the reader, in the following description I will refer to the line numbers located on the left edge of the sheet.
The sheet is here divided into three parts.
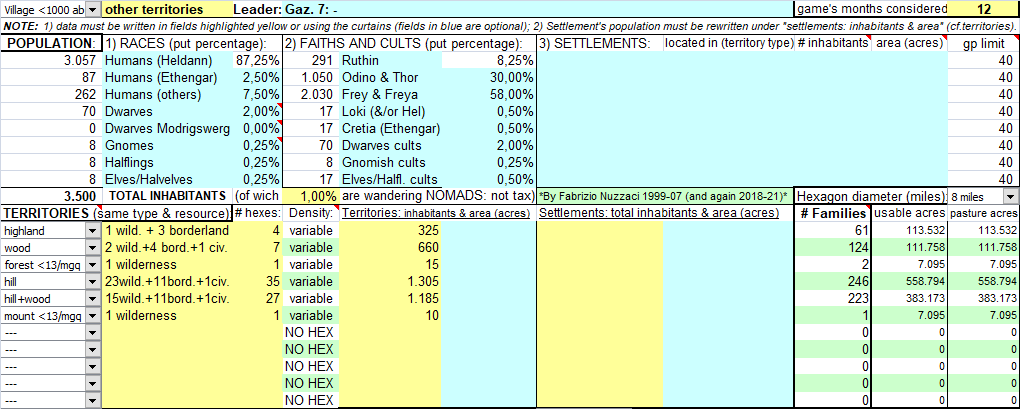
PART 1 (lines 1 to 25): Domain, Leader, Population and Territory
Table1
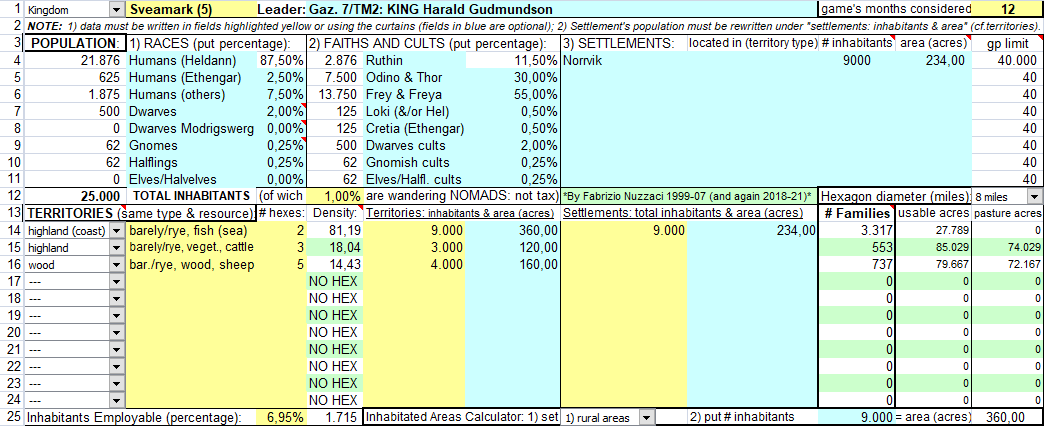
- Line 1: domain’s type and name, name of the leader, number of game’s months of play considered;
- Lines 3 to 11: description of the population based on races and cults, followed by a list of main settlements (name, inhabitants, territory type where it is located, housing surface - in acres - and gp limit for each settlement);
- Line 12: total number of inhabitants, percentage of nomadic population (not controlled, nor taxable), diameter of the hexes on the map (in miles);
- Lines 13 to 24: description of the territories (grouped by homogeneous types and resources) and related number of hexes, density, inhabitants of rural areas and housing surface (in acres), inhabitants of urban areas and housing surface (in acres) (note: data for the urban areas corresponds to those in lines 3 to 11), number of families available for production (excluding the “nomads” and the “employable” inhabitants), number of acres available for economic activities and number of residual acres for pasture/breeding only;
- Line 25: percentage and number of “employable” inhabitants, followed by a calculator used to determine the housing surfaces of the urban/rural population.
PART 2 (lines 27 to 99): Production, Balances (economic and food), Notes on the Domain, etc.
Table2
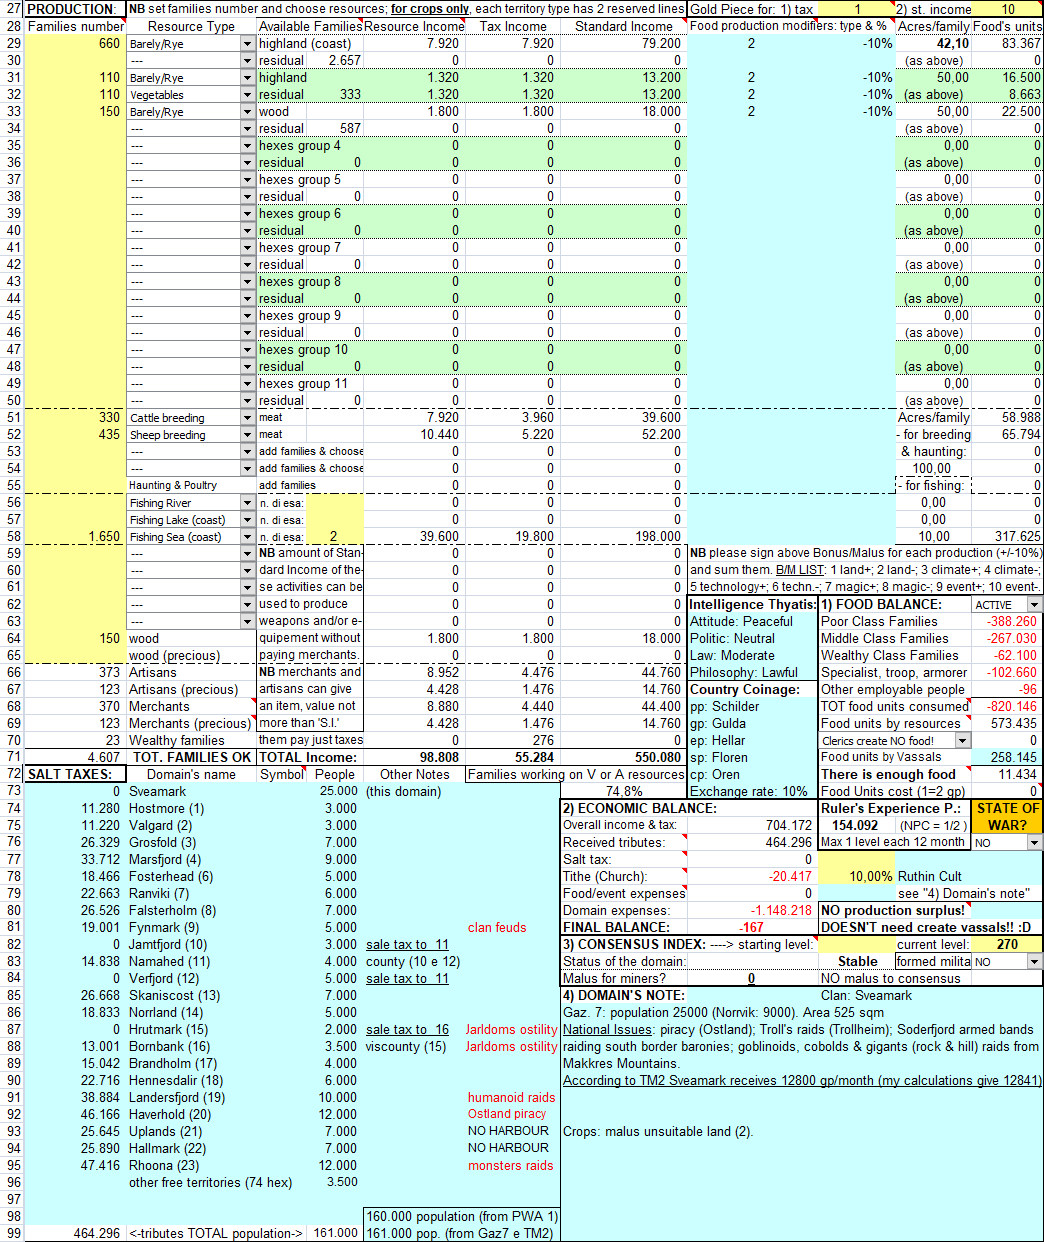
- Line 27: the rightmost section indicates the levels of Taxes and Standard Income (gp);
- Lines 29 to 50: number of families employed on vegetable resources distinguished according to the types of the domain territories (see lines from 13 to 24) (note: each type of territory has two lines for its vegetable resources), followed by the number of “still available” families in each territory after having assigned those dedicated to cultivation (they can be assigned to animals, minerals or wood resources, or living as artisans, merchants or wealthy) the collected gp (for tax on the resource, taxes and standard income), any bonus/malus to the food production (type and percentage); number of acres used by each family (max 50) and the "food units" produced;
- Lines 51 to 55: the number of families employed for breeding distinguished according to the type of animals*, the product obtained (meat, honey or silk), the collected gp (for tax on the resource, taxes and standard income), any bonus/malus to the food production (type and percentage); number of acres used by each family (max 100) and the "food units" produced;
(*) in practice, the breeders of the various territories are added together according to the type of breeding.
Lines 56 to 58: the number of families employed for fishing, distinguished according to the place of activity (river, lake or sea)*, the number of hexes exploited, the collected gp (for tax on the resource, taxes and standard income), any bonus/malus to the food production (type and percentage); the acres used by each family (max 10) and the "food units" produced;
(*) in practice, the fishermen of the various territories are added together according to the place of fishing.
Lines 59 to 70 (7 columns on the left): the number of families employed on "mineral" or wood resources, or artisans, merchants and wealthy families without considering in which territory they live*, and the collected gp (for resource tax, taxes and standard income);
(*) in practice, all these are added together according to the type of activity, or social condition;
- Line 71 (7 columns on the left): the totals of the employed families and of the various income received (gp);
- Lines 72 to 99 (6 columns on the left): the Sat Taxes received by the vassals (reported in the Economic Balance; see below), relative inhabitants and any notes;
- Lines 62 to 73 (right side sections): Thyatian Intelligence informations (see TM2), local currencies and exchange rate, Food Balance of the domain; percentage of families employed on vegetable or animal resources;
- Lines 74 to 99 (right side sections): Economic Balance, PX obtained by the Leader, State of War (if any), Consensus Index, Militia (if formed), Malus for too many miners (if too many), Notes on the Domain.
PART 3 (lines 101 to 182): Expenses
Table3
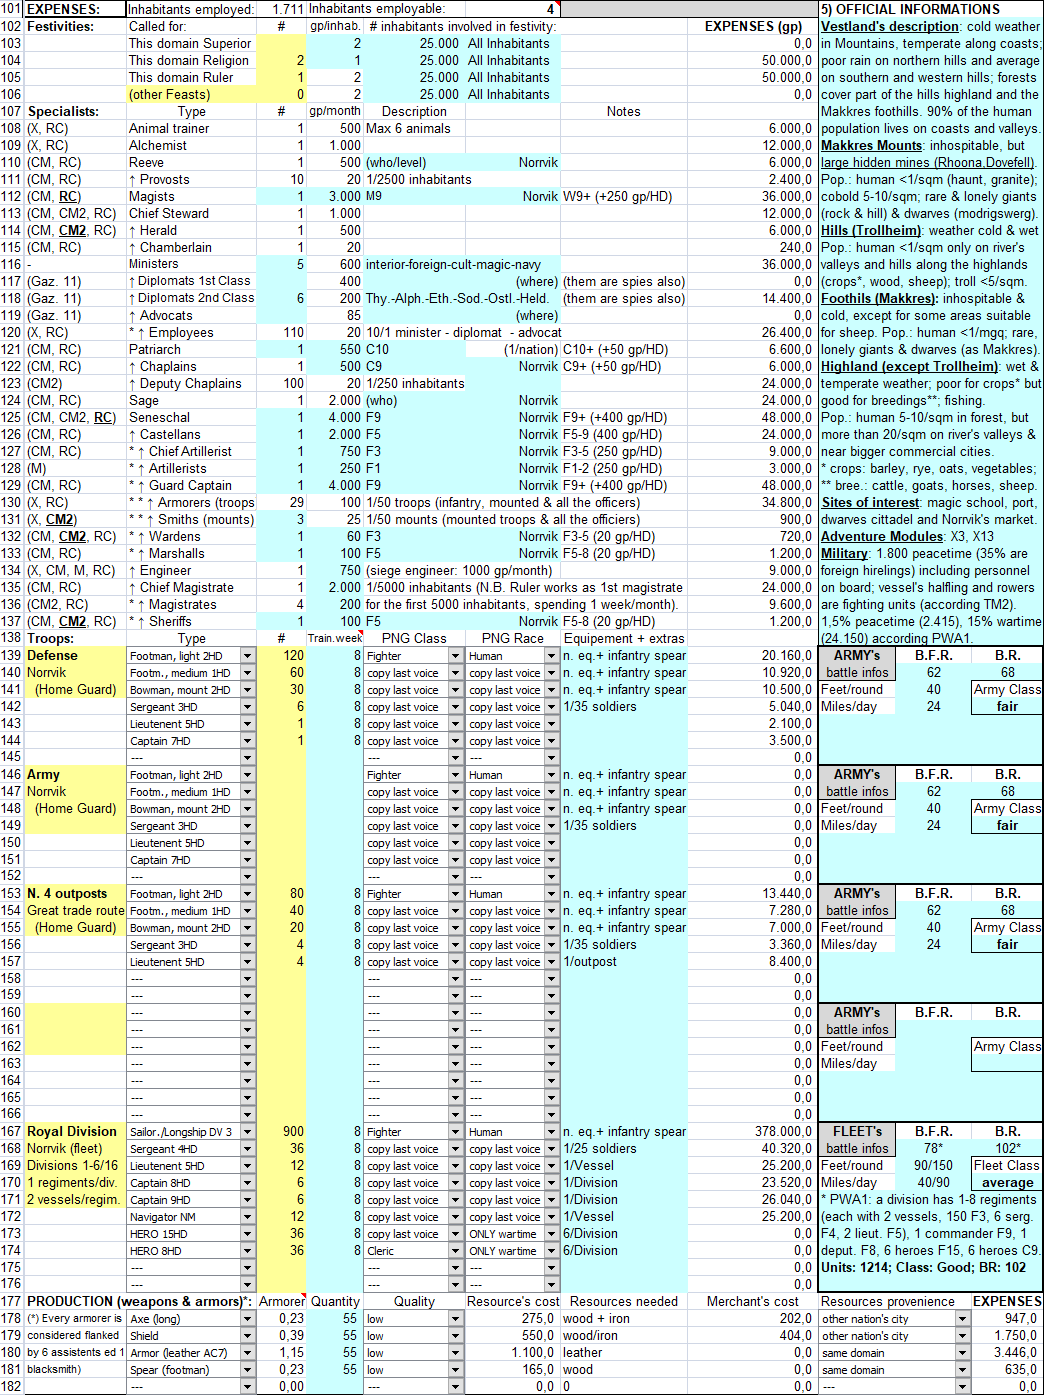
- Lines 101 to 137: inhabitants employed and still employable (line 101); expenses for festivities3 (type, number, cost per family, number of families, total cost) and specialists (type, number, monthly cost, description and notes, total cost); in the rightmost section are noted informations obtained from the game’s books;
- Lines 138 to 182: expenses for military, both armies and fleets (location and identification of each army/fleet, number and type of the troops, number of weeks of training, class, race, equipment and extras, total cost, CDB and BR, speed4), and for weapons production (type, number of gunsmiths5 - hired even in fraction - quantity and quality of produced equipements, cost and type of resources needed, expenses for any merchants according to their origin and total cost).
*****
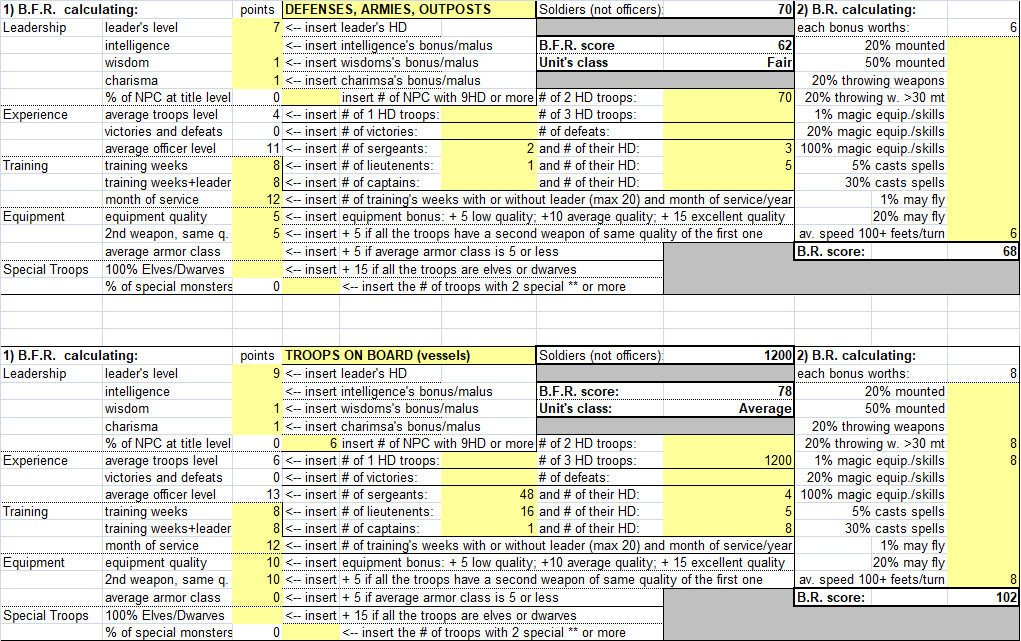
Below I show calculations I made to determine BFR, Troop Class and VB for each army and fleet of Vestland.
As written above, only this example spreadsheet shows the correct battle's values.
Table4
C) SUMMARY for the whole nation:
It is a single spreadsheet in which there are 3 tables with:
- a summary of the population density of each fief, according to the type of territory;
Table5
-
a summary of the deployed troops and fleets, of the tithes and cults,
and of the clerics supported by each fief; in the lower part, are
calculated clerics supported by the population, based on the
diffusion of each cult (these latter are
chaplains "of the
people", distinct from those "salaried" by individual
feudal lords);
Table6
A
summary of the population density in the hexes not ruled by any of
the fiefdoms.
Table7
I
hope you have fun in this land of brutal warriors, magical runes and
wise women!
Enjoy!
Fabrizio Nuzzaci
1The information contained in the X10 “Red Arrow Black Shield” module (which takes place in 1200 AC) does not differ much: in that scenario Vestland provides "2 divisions", each with "BR 102" and made up of "882 men "(total 1,764 men), organized as follows: F9 commander, F8 deputy commander, 6 F15 heroes, 6 C8 heroes and "7" regiments each made up of 120 F3, 3 F4 sergeants and 1 F5 captain.
2The Excel generator used in this article has not yet been completed by the author for publication but may be shared in the Vaults at a later time.
3festivities expenses are deducted from the amount paid for Salt Tax and Tithe.
4I beg your pardon, the measurements of these speeds has remained the ones obtained with the metric system adopted in Italian books; in particular, to have the effective number of feet and miles, you have to multiply the figure indicated here by 3 (feets) or 0.75 (miles); these are the original conversion rates adopted by D&D italian translators. Recently I corrected this error on this example spreadsheet (Sveamark).
5For each indicated gunsmith (or fraction), the file also automatically adds 2 blacksmiths and 4 assistants.