
Economics of the Emirates of Ylaruam, AC 1000
by Fabrizio Nuzzaci from Threshold Magazine issue 29
Welcome everyone to my DEFINITIVE* version (7.4+) of the Emirates of Ylaruam (April 30th, 2022).
(*) Actually I already wrote the word “definitive” in a previous publication (2021), but that wasn’t the time: I had to make several corrections, at different times, for issues related to the food production (e.g. in my previous simulations I gave to the deputy chaplains the power to create food like C10+; but I noticed deputy chaplains are low level clerics—lesser than 5HD—so they cannot create food (they need a magic rod to do so) and some other questions. Indeed, Ylaruam has been a huge test of the entire system.
With these simulations I try to visualize, on hex maps, the settlement areas of human populations and other “friendly” peoples, basing myself as much as possible on the available game information (and integrating them where missing).
Then I simulate the economies of the various domains found there.
This could be useful for both in-game campaigns (“where are the bad guys?”) and for the creation of domains by the PCs.
During an RPG session, have you ever asked yourself questions like “How many dwellers could live in that map hex?”, “How many troops can that nation enlist?”, “How many resources can I get if I conquer my neighbor?” Here I try to give an answer.
If you intend to play and enjoy the pleasure of adventure, stop reading here (cit.)
(How much I love this sentence).
The Demographic Maps
I
must first thank Thorfinn Tait for his great work in mapping Mystara
and his generosity, giving me the possibility to modify his maps. In
particular, the one used here is an “updated”
map,
not faithful to the original.
Regarding Ylaruam, I drew up 3 different demographic maps (basic demographic, density and military).
Compared to the original map as modified by Thorfinn, on these maps I have:
1) increased the number of vassal domains (all bordered in red and white), due to the reasons you will read below.
The new ones are:
- 4 vassals of Alasiya (Deraan, Hedjazi, Sulba and Kuznetz), created both to respect the surplus limit of 15,000 gp/month resources income (according the Rules Cyclopedia dominion’s economics), to better represent the feudal system and due to the big distances from the capital city of Ylaruam;
- 1 vassal of Nicostenia (Cubis), created to respect the surplus limit (see Alasiya, above);
- 1 vassal of Nithia (Cinsa-Men-Noo), due to the significant differences between the coastal part and the internal area;
- 2 vassals of Abbashan (Jaboor and Fabia), due to the significant differences between the coastal part and the internal area.
2) I’ve added some settlements on some wilderness hexes on the commercial route between the emirates of Dithestenia and Nicostenia (as described in GAZ2 The Emirates of Ylaruam).
3) I’ve added the Barimoor’s Underground Complex (as described in GAZ2, but not found on Thorfinn’s map).
4) I’ve determined the population of the village of Dar el Tamyya (already on Thorfinn’s map) at 300 inhabitants (the difference between the Emirate’s total population of 229,700 indicated in GAZ2 and the 230,000 inhabitants indicated in PWA1 Poor Wizard’s Almanac AC 1010 and TM2 The Eastern Countries Trail Map).
5) I’ve changed the position of the village of Kirkuk (already on Thorfinn’s map, where it was placed in an isolated location on the trade route in Dithestenia-Nicostenia) for the following reasons:
- Dithestenia is a really under-populated Emirate: I think we cannot place there the village of Kirkuk simply because this Emirate hasn’t enough population; in fact, there are 400 people living in Kirkuk, at least 650 nomads living around it, plus a group of 130 bandits: too many people (400+650+130 = 1,180 people) for the under-populated Dithestenia (it has a total population of 7,600 mostly concentrated around the main city; thus, surely, cannot have 1,180 of them in a single area in the middle of its wilderness hills);
- Barimoor’s Agents strike Kirkuk (this means Kirkuk must be close Barimoor’s underground complex; the hills in the middle of Dithestenia aren’t);
- GAZ2 describes Kirkuk as a city in a hilly region close to the Altan Tepes (there are rains), but it’s also very close to the desert;
I preferred placing Kirkuk in Makistan, where we meet all the conditions described in GAZ2 (even the presence of the ruins of the Thyatian fort could be reasonable) and this makes the village a “key-place” to keep away Barimoor’s enemies. And, last but not least, there we also meet the population requisite (in my simulation, 1,225 people live in the hex of Kirkuk and the surrounding hexes).
Note: another good placement (there is a “Thyatian fort”) could be in Nicostenia (the 2nd hex, south/west Cubis) but, again, Cubis seems far from Barimoor’s underground Complex.
A final note on Makistan: surely you will notice that I have not created vassals in Makistan, although this emirate has a population of 31,800 (a few more than Abbashan) and 4 cities; and despite GAZ2 stating there are more Makistani “clans.” This has been my choice (“Makistan united!”) and by clan we mainly mean a social organization, not necessarily a political entity; but you may easily change it.
Based on a simulation I made, Makistan can be divided into 2 domains: a main emirate (Parsa–Anram) and a vassal sheikhdom (Uruk–Warqa); the vassal will rule the northern area (11 civilized grasslands and 2 or 3 border grasslands).
From a military point of view, the only Makistani Regular Division (labeled as “10th” in the Makistani sheet) will have 4 regiments (instead of 5), due to the administrative expenses of the two domains; while the defenses of the cities will remain unchanged and the personal guard (of the emir and the sheik) will be 20 units each (instead of 40).
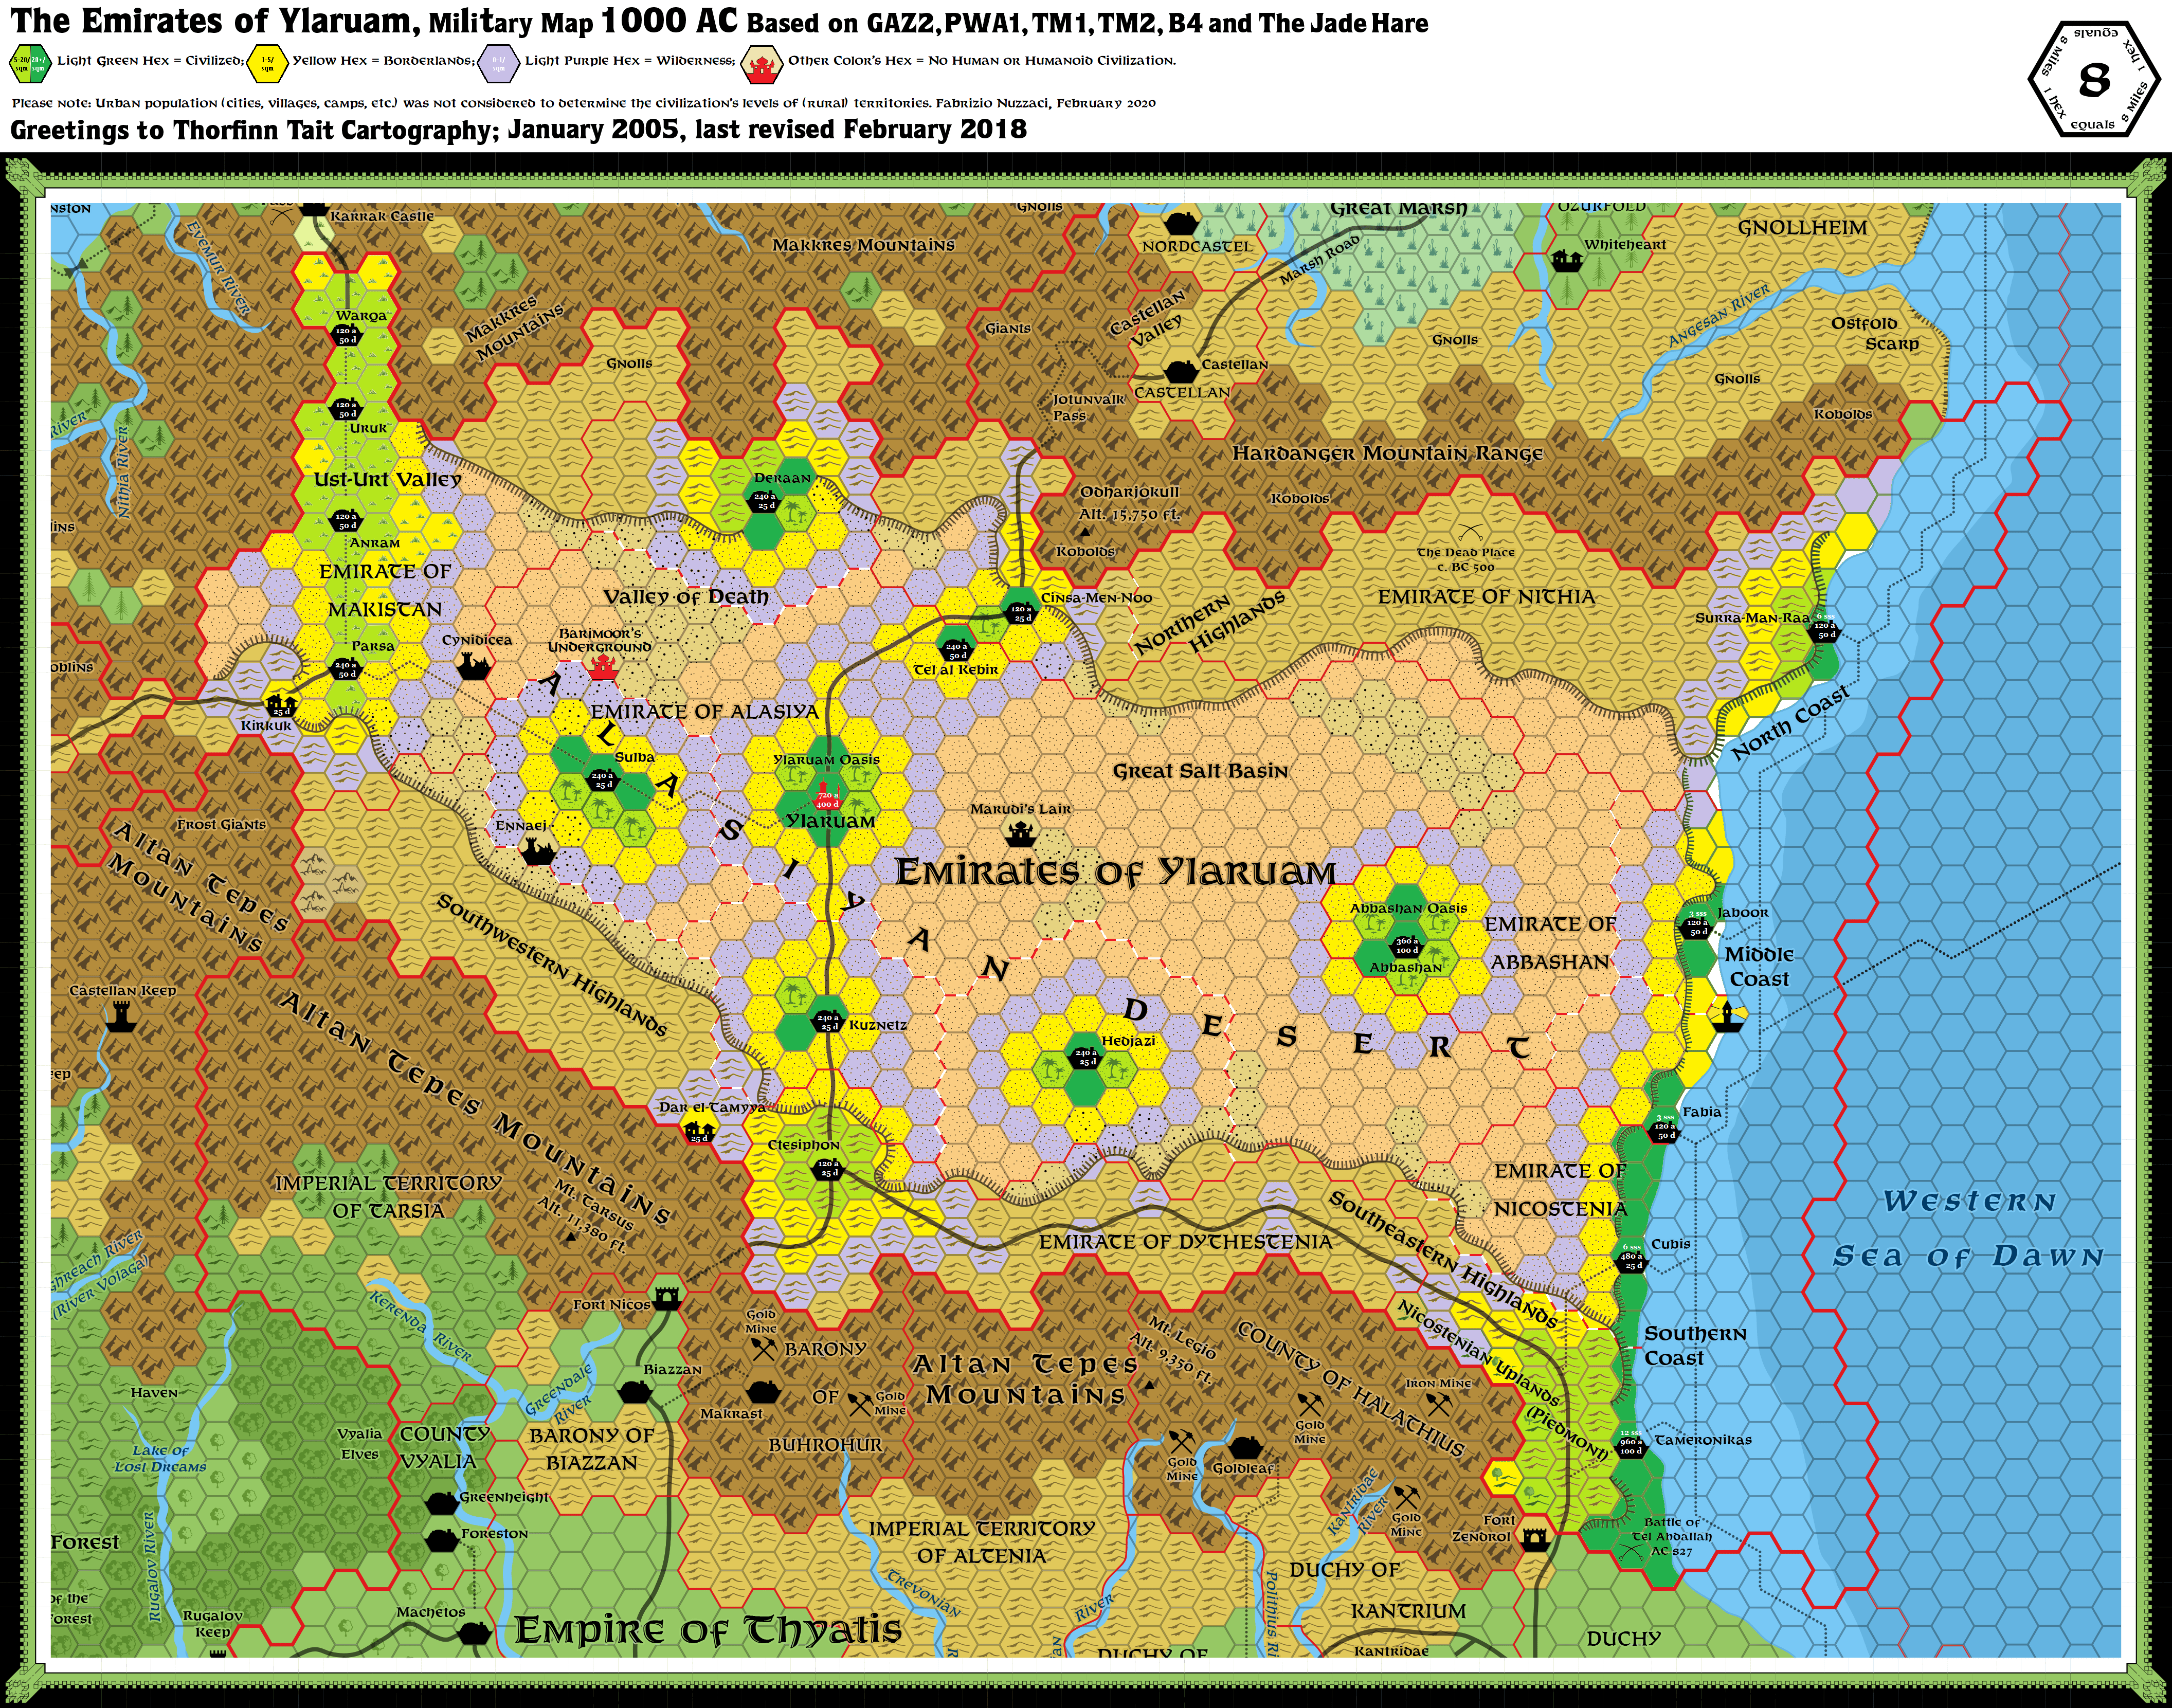
1) basic demographic map
Map
1: Demographic map
http://pandius.com/Ylaruam8mMIADemograficaUpdatedThorfinn.png
Map 1 shows the distribution of the population, highlighted in color:
- dark green = very civilized (density greater than 20 inhabitants per square mile);
- light green = civilized (from 5 to 19.99 inhabitants per square mile);
- yellow = borderland (from 1 to 4.99 inhabitants per square mile);
- purple = wilderness (from 0.01 to 0.99 inhabitants per square mile);
- other colors = no human population (but ... what about monsters?).
GAZ2 provides the following information about the civilization level of the various territories, expressed in inhabitants per square mile (sq. mi.):
- coastal plain (civilized): 40–70 inhabitants / sq. mi. (more in the major cities of Nithia–Abbashan–Nicostenia), but note that Jaboor’s coastal plains cannot have so much;
- steppe (civilized): 10–20 inhabitants / sq. mi.;
- hills (civilized): 5–10 inhabitants / sq. mi.;
- hills (and any other territory), borderland: 1–5 inhabitants / sq. mi.;
- hills/desert (and any other territory), wilderness: less than 1 inhabitant / sq. mi.;
- desert/borderland: 30–60 inhabitants / sq. mi. (this is definitely a MISTAKE: borderland areas cannot have more than 5 inhabitants / sq. mi.).
I had to integrate these values with the following:
- plain (civilized): 20–30 inhabitants / sq. mi.;
- oasis (civilized): 10–20 inhabitants / sq. mi.
2) density demographic map
Map 2: Density map
http://pandius.com/Ylaruam8mMIADensitaUpdatedThorfinn.png
Map 2 shows the population density of a single hex (or groups of hexes), rounded to the second decimal place.
For the sole purpose of population density, it should be noted that the population residing in urban centers is not added to that living on the single hex of the territory. This is due to my method in simulating economies.
Now, knowing that an 8-mile-diameter hex has an area of 55,426 square miles (sq. mi.), it is easy to calculate how many inhabitants live (on average) in a given hex (or group of hexes) of the map; as written just above, this number does not include the population of any urban centers.
Otherwise, more simply, look at the individual details of the domain you are interested in.
In my representation I have distributed the entire population indicated in PWA1 and TM2: 230,000 inhabitants (note: GAZ2 instead indicates a population of 229,700).
For those who want a setting with a greater extent of human presence, it would be enough to halve the density of wilderness hexes to double their number; I consciously indicated a density of 0.90 inhabitants / sq. mi. (or 50 inhabitants per hex) for all the wilderness areas due to this reason.
However, in this way, you would have a more or less stable human presence even in “very hot” areas (primarily, above the underground complex of Barimoor) as well as at a considerable distance from the most important population centers (up to 24 miles in the desert maybe it would be too much ... but this, of course, is just my opinion).
Anyone who wants to is always free to add more population according to his campaign.
3) military demographic map
Map 3: Military map
http://pandius.com/Ylaruam8mMIAMilitareUpdatedThorfinn.png
Map 3 shows the military units supported by the single domains in peacetime.
Explanation of the annotations:
- “3 sss” means 3 small sailing ships, whose crew is composed and equipped as described in PWA1 (page 130);
- “400 d” means 400 defensive F1 archers (officers excluded), equipped with normal sword and short bow; each defensive army is ruled by 1 sergeant every 25 troops, 1 lieutenant every 100 troops and 1 captain where there are more than 1 lieutenant;
- “720 a” means 720 attacking F2 mounted archers (officers excluded), composed and equipped as described in PWA1 (page 130).
Note: Every domain also has 20 (or 40) F3 archers (plus officers) as personal guard of its ruler (Sultan, or Emir, or Sheik).
So, for example:
- Tameronikas (“12 sss”, “960 a” and “100 d”) stably deploys 12 small sailing ships, 960 F2 for attack and 100 F1 for defense; it has also 40 F3 (plus 2 sergeants, 1 lieutenant and 1 captain) as its Emir’s personal guard.
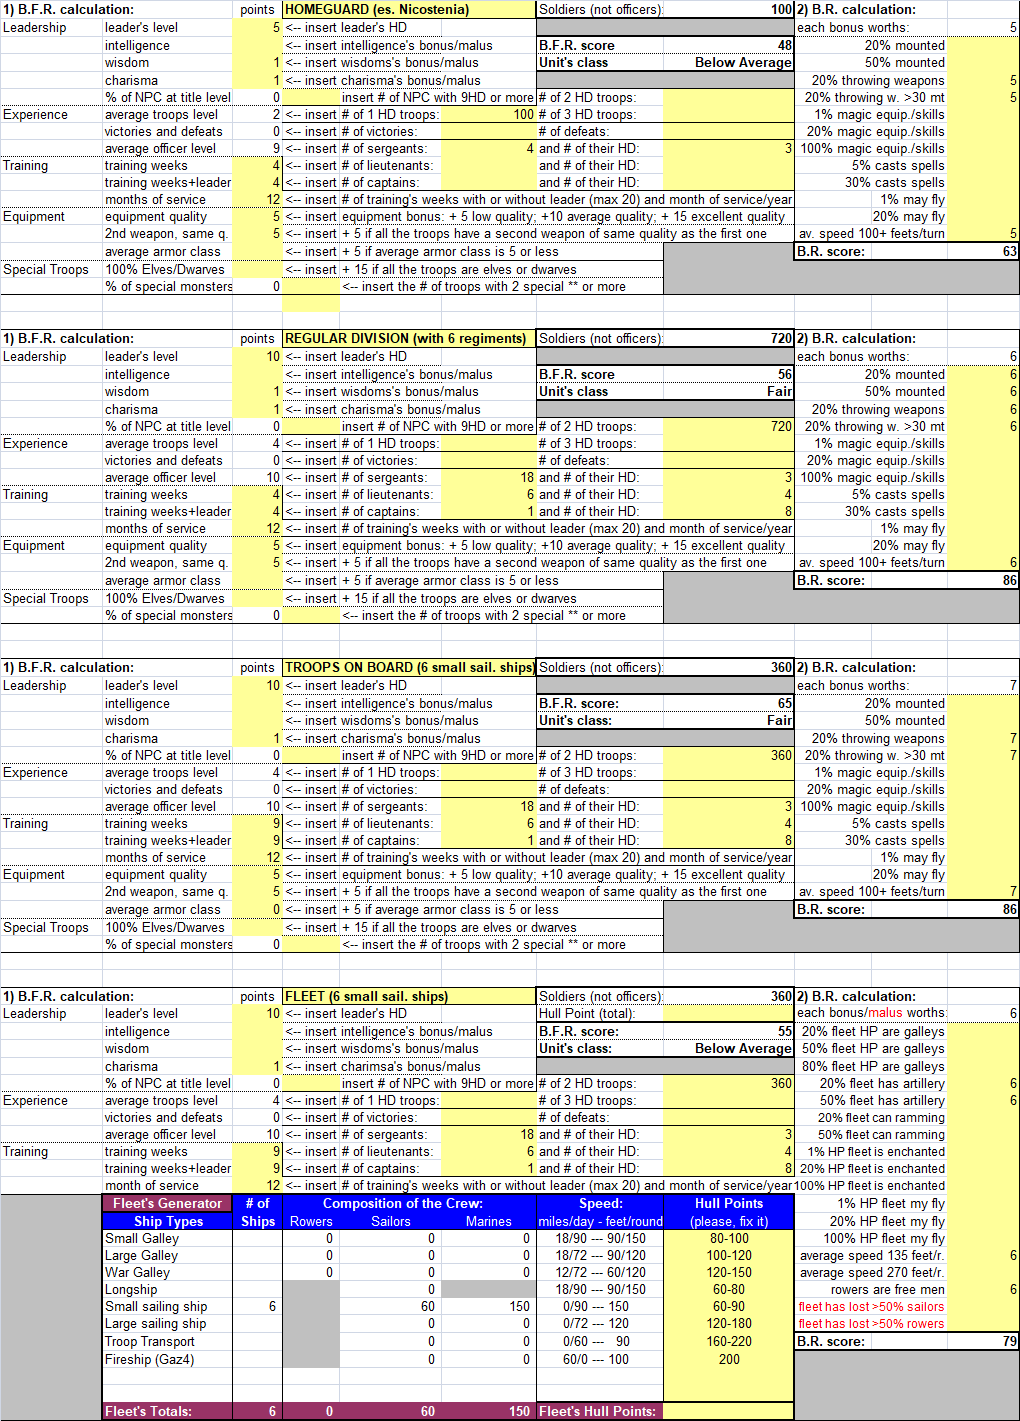
In my simulation, in peacetime, the emirates deploy just some of the regiments of the 10 Royal Naval Divisions and of the 14 Regular Divisions described in PWA1 (page 130):
- each Royal Naval Division (Navy) is commanded by a F10, has a F8 deputy commander, 5 C8 heroes, and 1 regiment; each regiment has 3 small sailing ships, 60 F2 archers (equipped with sword and short bow), 3 F3 sergeants, 1 F4 captain and 1 navigator;
- each Regular Division (Land Army) is commanded by a F10, has a F8 deputy commander, 10 C8 heroes, and 1 to 5 regiments (depending on the economic capacity of the domain that supports it); each regiment has 120 F2 mounted archers (equipped with sword and short bow), 3 F3 sergeants and 1 F4 captain;
Note: There are 4 domains that concur to form just 2 Regular Divisions: Jaboor and Fabia (12th Regular Division); Nithia and Cinsa-Men-Noo (13th Regular Division).
This is indicated in the individual domain sheets (continuing the example: Jaboor: “Division 12-I/14, Regiment 1/2” and Fabia: “Division 12-II/14, Regiment 2/2”), and is highlighted in the summary (by a rectangle that encloses the “land” troops of the two domains involved); in these cases, finally, the senior officers are one dependent of one domain and the other dependent of the second (continuing the example: Jaboor supports the F10 captain and Fabia the F8 captain).
In wartime, both Royal Naval and Regular Divisions increase the number of their regiments to 6 (see PWA1, page 130).
Economic Simulations
You may find at this link https://www.thepiazza.org.uk/bb/viewtopic.php?t=29246 the high definition pictures of spreadsheet detailing the economic simulations for the 14 individual domains of Ylaruam. The main one of them—Alasiya—follows below.
All these economic simulations have been developed referring to the information and descriptions provided in GAZ2 and TM2; all the Emirates’ “Regular Divisions” (land) and “Royal Naval Division” (sea) armies are composed as described in PWA1 (page 130), while the defensive forces (“Sultan/Emir/Sheik Guard” and “Homeguard”) differ only for a higher HD level (the “Sultan/Emir/Sheik Guard”) and/or a higher ratio of officers/troops (both). However, I tried to remain consistent with the official information as much as possible.
The resources (vegetables, animals and minerals) of each domain are based on the descriptions given in GAZ2.
For the purpose of the constraint of assigning at least 20% of households to each resource, population has been distributed referring to 8-mile (instead of 24-mile) hexes.
The rules for calculating income and expenses of individual domains applied here are mainly based on the rules of D&D BECMI-Rules Cyclopedia, albeit with some of my additions (eg. families engaged in trade, crafts or wealthy).
TM2 indicates that Ylaruam (or the entire Kingdom) has an availability of 6,900 gp/month; my calculations show that Alasiya (the main Emirate) receives taxes and fees for a total of 18,096 gp/month, but the Final Balance shows about 8,486 gp/year (about 707 gp/month). To have the complete availability of the Kingdom we should add the Final Balance of the entire Emirates, obtaining a total of about 44,012 gp/year (or about 3,667 gp/month), but too many factors may change this result.
Regarding the Salt Tax paid to Alasiya by the Emirates of Nicostenia, Makistan, Abbashan, Nithia and Dithestenia, I have to say that I fixed it at 10% due to the simple reason that, with a higher tax, some of them (e.g. Dithestenia) would not sustain even a simple regiment of the Regular Division; and Alasiya would have a too large army. We may agree that the main Emirates pay a lesser Salt Tax to Alasiya because they are federated with it; while the minor domains (e.g. Sulba) pay the usual Salt Tax of 20% as vassals.
Also for the cost of troops and specialists I had to integrate the official game rules. For example:
- the cost of a soldier with 2 HD (or 3 HD) is increased by + 10 gp/month (or + 20 gp/month) compared to the base cost indicated for soldiers with 1 HD (see D&D Expert Set);
- the cost of sergeants is 20 gp/HD/number of months of service (while, following the BECMI rules, a sergeant with 4 HD would cost only 20 gp/month); and even more for the superior officers.
Shortly, in peacetime Ylaruam has a TOTAL of 6,745 troops (of which: 1,225 defensive, 4,920 attacking and 600 embarked; I didn’t add the personal guards of Sultan/Emir/Sheik), that is more than indicated in TM2 (2,860 troops) or in PWA1 (1.5% of 230,000 inhabitants = 3,450 troops)1. But, please, note that in this way the poor Dithestenia can support at least 145 of these: 25 archers 1 HD (Homeguard of Ctesiphon) and 120 mounted bowmen 2 HD, composing the single regiment of the 14th Regular Division!
On other topics, however, I tried to make a more realistic simulation. For example, the Food Balance section is based on rules that I wrote after reading several articles.
But, even here, keeping an eye on the game’s descriptions:
- near all the Emirates (not Nithia) benefit from the Garden in the Desert technology bonus (+10% crops production); we could immagine clerics helping people to increase cultivations;
- I didn’t admit Deputy Chaplains may magically create some food to help the population, because this power is given to higher level clerics (10 HD);
- the Emirate of Dithestenia and some other minor domains (Deraan, Hedjazi, Kuznetz and Cinsa-Men-Noo) don’t produce enough food to sustain their population; when possible, they buy the needed food units from merchants (Deraan), otherwise them receive it for free by their superior domain (Hedjazi and Kuznetz by Alasiya; Cinsa-Men-Noo by Nithia).
One final note: the Order of Eternal Truth (the main cult) receives 168,372 gp/year from tithes; offerings by the faithful should also be added to this sum.
How to spend these sums, I leave it to the imagination of those who want to use this system.
Example Economic Simulation: Alasiya
What follows is my economic simulation for Alasiya (Ylaruam’s main Emirate), published with the aim of explaining to the readers how and where to look for information of interest to them, both in this and in the other economic simulations referred to in this article.
Therefore, this is not a clear and complete explanation of all the work behind these sheets, nor of the information on which I relied.
I would also like to point out that some of the information present in this, as in the other sheets, are also reported in the demographic maps (basic, density and military) included in this article; however, only the spreadsheets will provide complete information on each domain.
To carry out this work I used my Fiefs Generator (v. 7.4+), which I adapted to the rules for managing domains described in D&D BECMI (and then in Rules Cyclopedia), with a single hint from D&D 3E (the gp limit) and some of my further additions aimed at making the simulation more realistic.
The ultimate goal of this work is to allow each DM to have quick and complete access to game information, providing a ready-made campaign and thus saving them preparation time.
To help the reader, in the following description I will refer to the line numbers located on the left edge of the sheet.
Note: GAZ2 (page 10) states that a relevant part of the Emirate’s population (“from 10% of the permanent population in large cities to a 200% of the population of small towns”) is “in transit” population (like “nomads, pilgrims, scholars …”). The consequence is that, surely, all the Emirates suffer due to the nomadic population (not taxable, not employable, not sharing food and not cooperative at all); thus I fixed the percentage of the nomadic people at 5% in all the domain sheets, but remember that this percentage could be different as the GM wishes … and this will have an effect on the production and income of your domains!
The sheet is here divided into three parts.
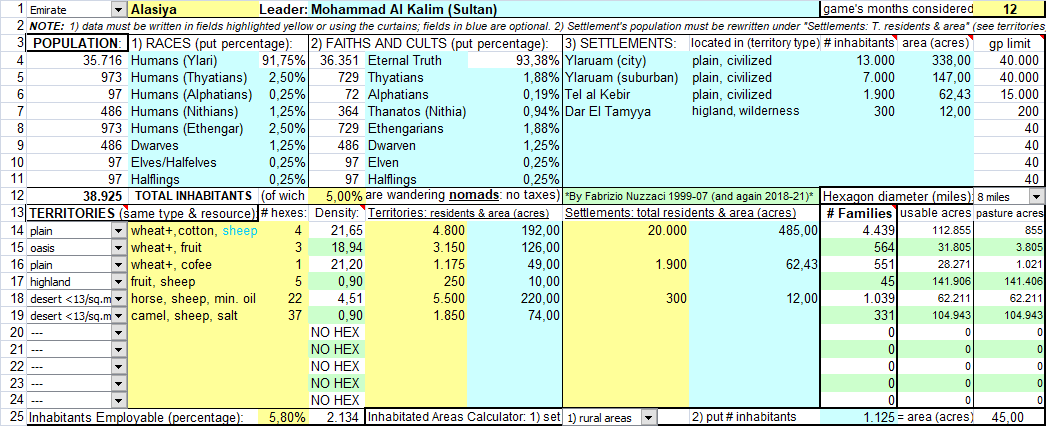
Part 1 (lines 1 to 25): Leader, Population, Faiths and Territory of the Domain
Table: Alasiya
-
Line 1: domain’s type and name, name of the leader, number of
game’s months of play considered;
- Lines 3–11: description of the population based on races and cults, followed by a list of main settlements (name, inhabitants, territory type where it is located, housing surface—in acres—and gp limit for each settlement);
- Line 12: total number of inhabitants, percentage of nomadic population (not controlled, nor taxable), diameter of the hexes on the map (in miles);
- Lines 13–24: description of the territories (grouped by homogeneous types and resources) and related number of hexes, density, inhabitants of rural areas and housing surface (in acres), inhabitants of urban areas and housing surface (in acres) (note: data for the urban areas corresponds to those in lines 3–11), number of families available for production (excluding the nomads and the employable inhabitants), number of acres available for economic activities and number of residual acres for pasture/breeding only;
- Line 25: percentage and number of employable inhabitants, followed by a calculator used to determine the housing surfaces of the urban/rural population.
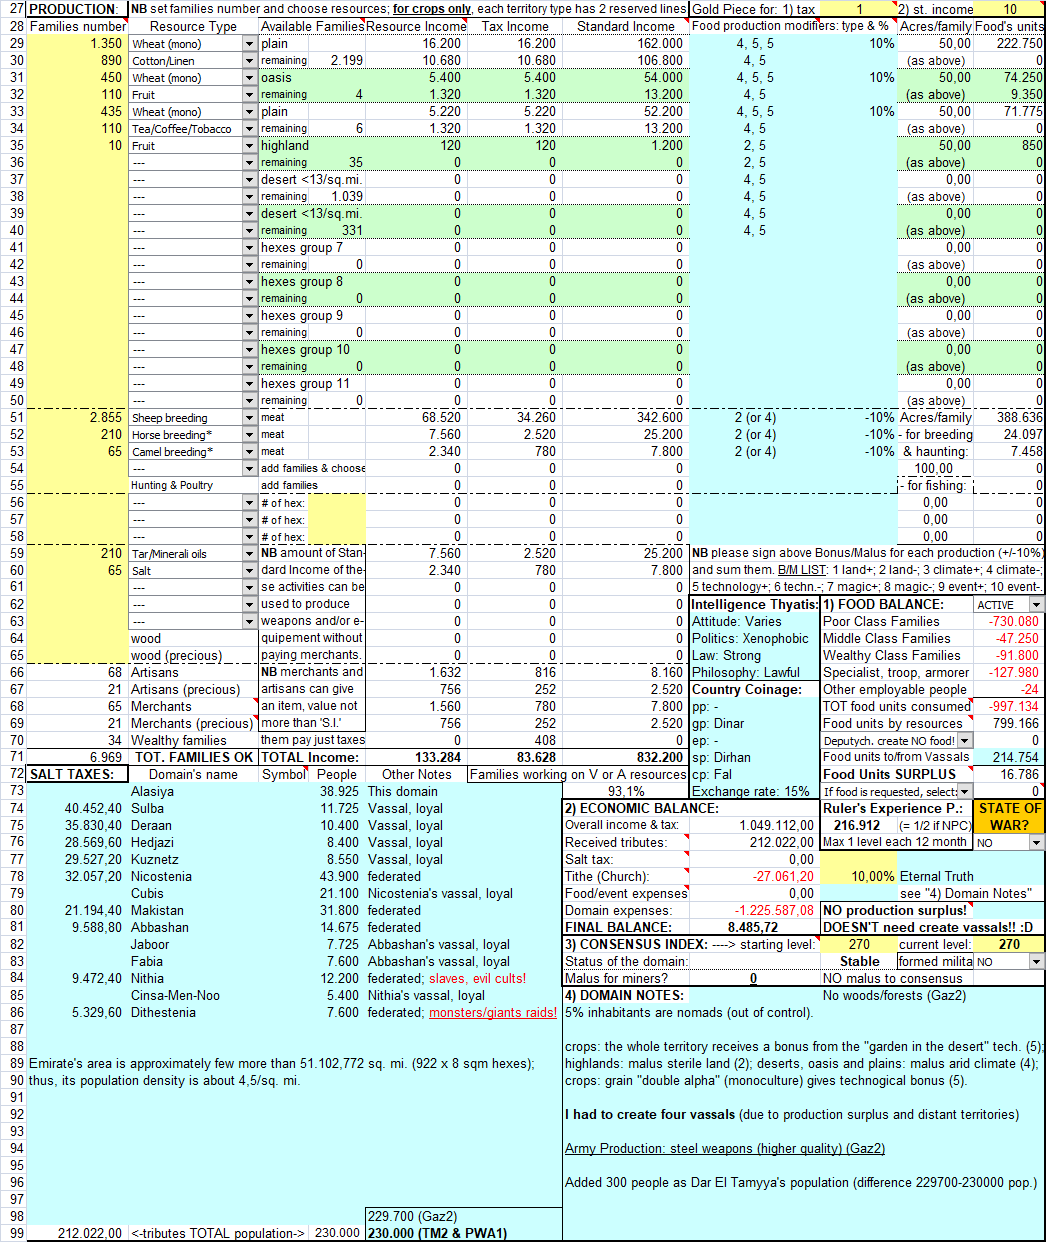
Part 2 (lines 27 to 99): Production, Balances (economic and food), Consensus, Notes and other on the Domain.
Table: Production
-
Line 27: the rightmost section indicates the levels of Taxes and
Standard Income (gp);
- Lines 29–50: number of families employed on vegetable resources distinguished according to the types of the domain’s territories (see lines 13–24) (note: each type of territory has two lines for its vegetable resources), followed by the number of still available families in each territory after having assigned those dedicated to cultivation (they can be assigned to animals, minerals or wood resources, or living as artisans, merchants or wealthy) the collected gp (for Resource Income, Taxes and Standard income), any bonus/malus to the food production (type and percentage); number of acres used by each family (max 50) and the food units produced;
- Lines 51–55: the number of families employed for breeding distinguished according to the type of animals*, the product obtained (meat, honey or silk), the collected gp (for Resource Income, Taxes and Standard Income), any bonus/malus to the food production (type and percentage); number of acres used by each family (max 100) and the food units produced;
(*) in practice, the breeders of the various territories are added together according to the type of breeding.
Lines 56–58: the number of families employed for fishing, distinguished according to the place of activity (river, lake or sea)*, the number of hexes exploited, the collected gp (for Resource Income, Taxes and Standard Income), any bonus/malus to the food production (type and percentage); the acres used by each family (max 10) and the food units produced;
(*) in practice, the fishermen of the various territories are added together according to the place of fishing.
Lines 59–70 (7 columns on the left): the number of families employed on mineral or wood resources, or artisans, merchants and wealthy families without considering in which territory they live*, and the collected gp (for Resource Income, Taxes and Standard Income);
(*) in practice, all these are added together according to the type of activity, or social condition;
- Line 71 (7 columns on the left): the totals of the employed families and of the various income received (gp);
- Lines 72–99 (6 columns on the left): the Salt Taxes received by the vassals (reported in the Economic Balance; see below), relative inhabitants and any notes;
- Lines 62–73 (right side sections): Thyatian Intelligence information (see TM2), local currencies and exchange rate, Food Balance of the domain; percentage of families employed on vegetable or animal resources;
- Lines 74–99 (right side sections): Economic Balance, XP obtained by the Leader, State of War (if any), Consensus Index, Militia (if formed), Malus for too many miners (if too many), Domain Notes.
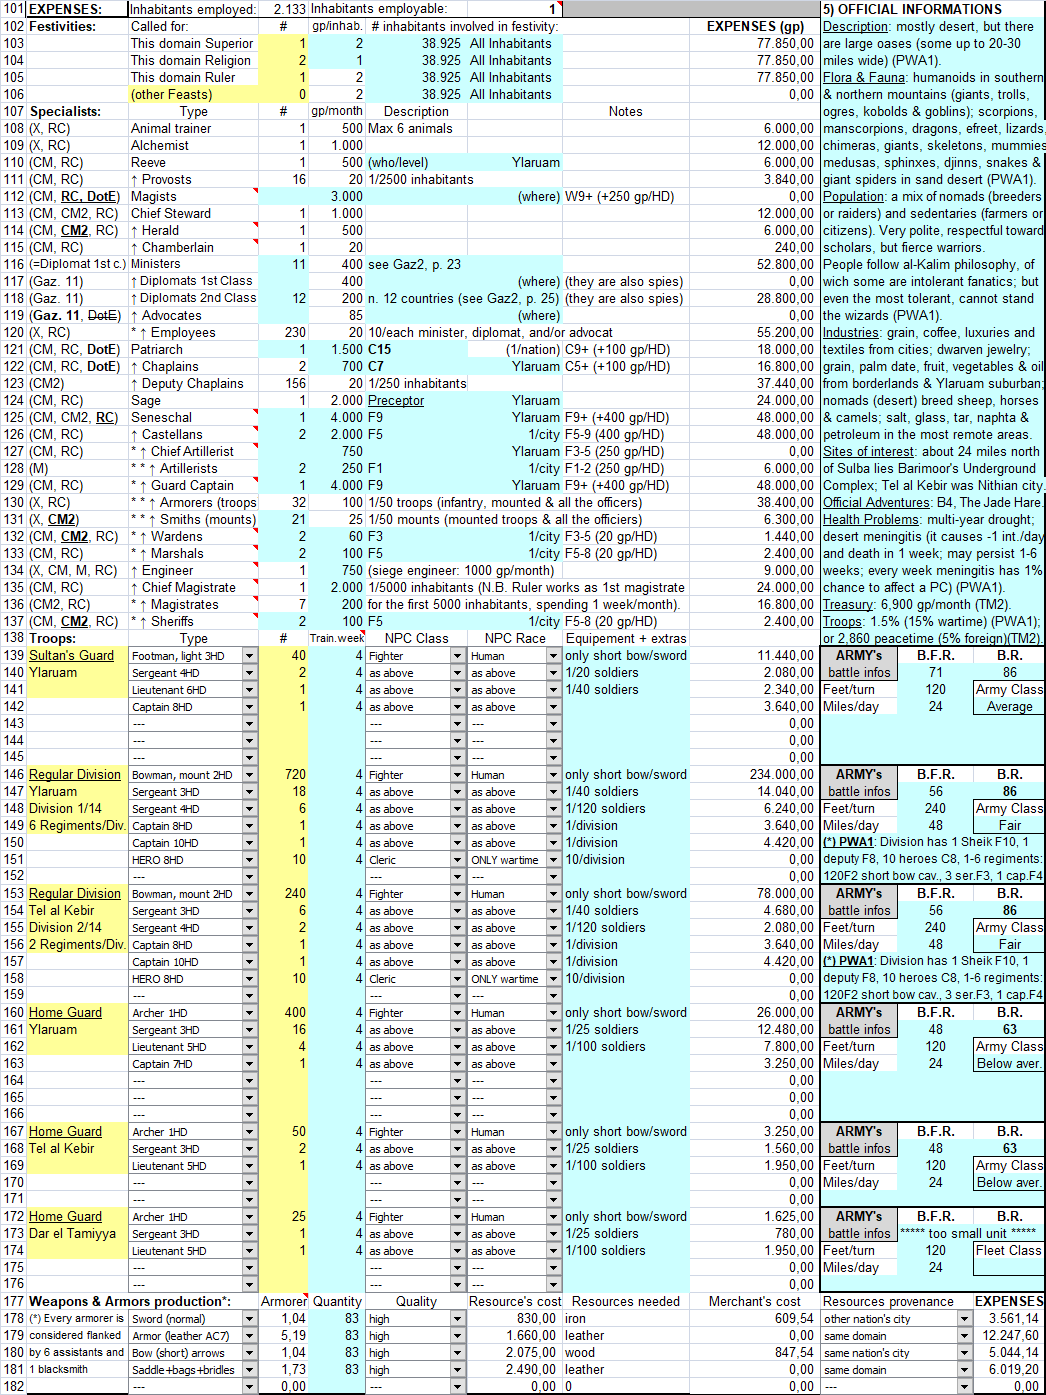
Part 3 (lines 101 to 182): Expenses of the Domain
Table: Expenses
-
Lines 101–137:
inhabitants employed and still employable (line 101); expenses for
festivities2
(type,
number, cost per family, number of families, total cost) and
specialists
(type,
number, monthly cost, description and notes, total cost); in the
rightmost section are noted information obtained from the game’s
books;
- Lines 138–182: expenses for military, both armies and fleets (location and identification of each army/fleet, number and type of the troops, number of weeks of training, class, race, equipment and extras, total cost, BFR and BR, speed), and for weapons production (type, number of armorers3 (hired even in fraction) quantity and quality of produced equipement, cost and type of resources needed, expenses for any merchants according to their origin and total cost).
*****
C) Summary for the whole nation
It is a single spreadsheet in which there are 3 tables with:
Table Dominions summary
- a summary of the deployed troops and fleets, of the tithes and cults, and of the clerics supported by each domain; in the lower part are calculated clerics supported by the population, based on the diffusion of each cult (these latter are chaplains “of the people,” distinct from those salaried by individual feudal lords);
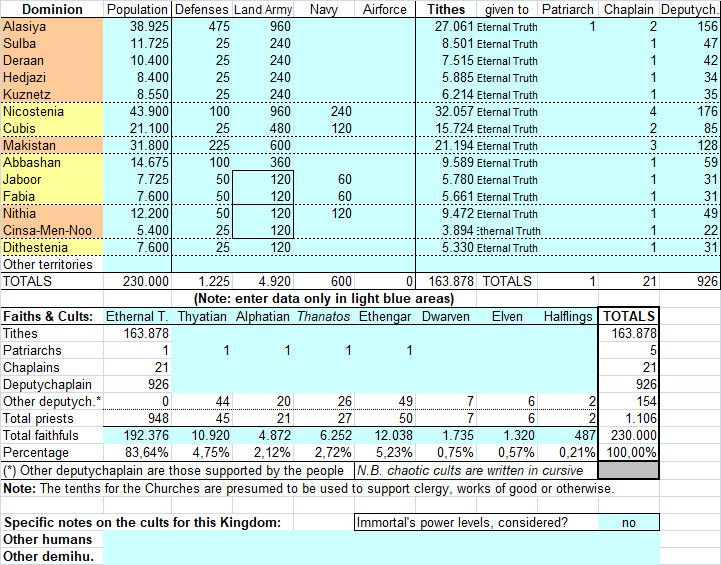
Table:
Population Density
- a summary of the population density of each domain, according to the type of territory;
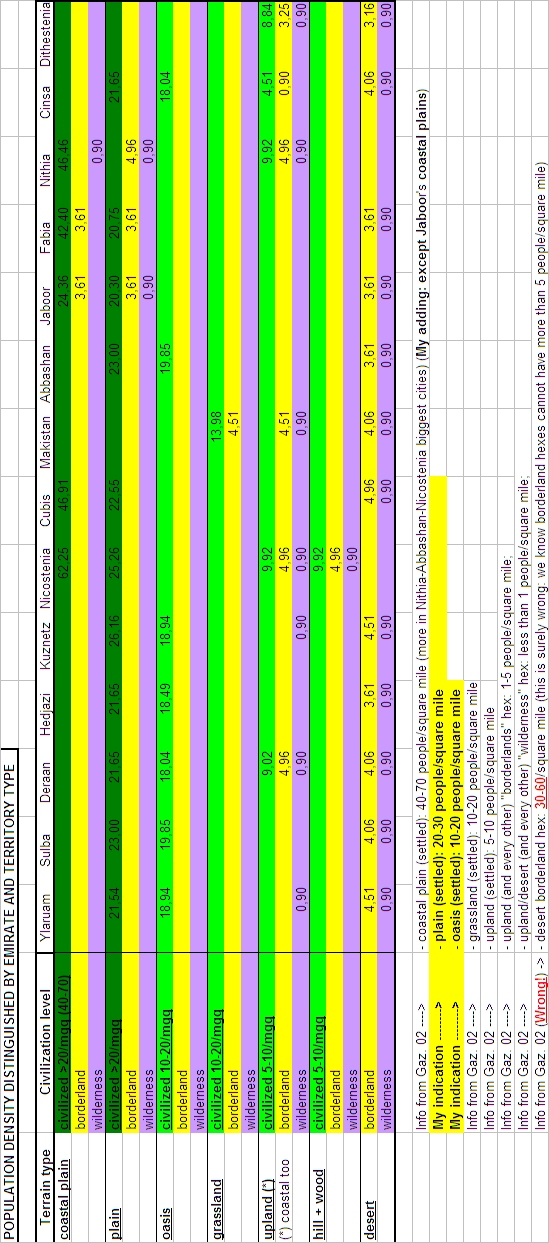
Table:
BFR
- my calculations to determine BFR, Troop Class and BR for each army and fleet of Ylaruam.
I
hope you have fun in this arid and dangerous land!
Enjoy!
Fabrizio Nuzzaci
1The information contained in the X10 Red Arrow Black Shield module (which takes place in AC 1200) have not been considered: in that scenario Ylaruam provides 14 divisions (land army), each with a BR of 151 and made up of 715 men (total 10,010 men), organized as follows: F10 commander, F8 deputy commander, 10 C8 heroes and 8 regiments (the first made up of 80 M2, 2 M3 sergeants and 1 M4 captain; the other seven each made up of 120 F2, 3 F3 sergeants and 1 F4 captain).
2Festivities expenses are deducted from the amount paid for Salt Tax and Tithe.
3For each indicated armorer (or fraction), the file also automatically adds 2 blacksmiths and 4 assistants (or fraction); fractions are rounded up to the 2nd decimal.